Global earthquake animation
from 2001 to 2015.
Tue Apr 29 2014
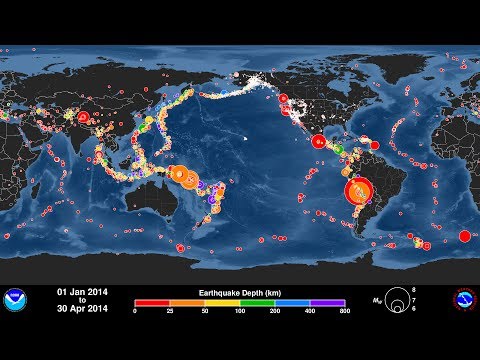
The first video shows an animated map created from some US agencies (the National Oceanic and Atmospheric Administration, the National Weather Service, and the Pacific Tsunami Warning Centre) that shows every recorded earthquake in chronological order from January 1, 2001 to December 31, 2015. The size of the circle shows the magnitude of the earthquakes in relation to each other. The colour represents the earthquake depth.
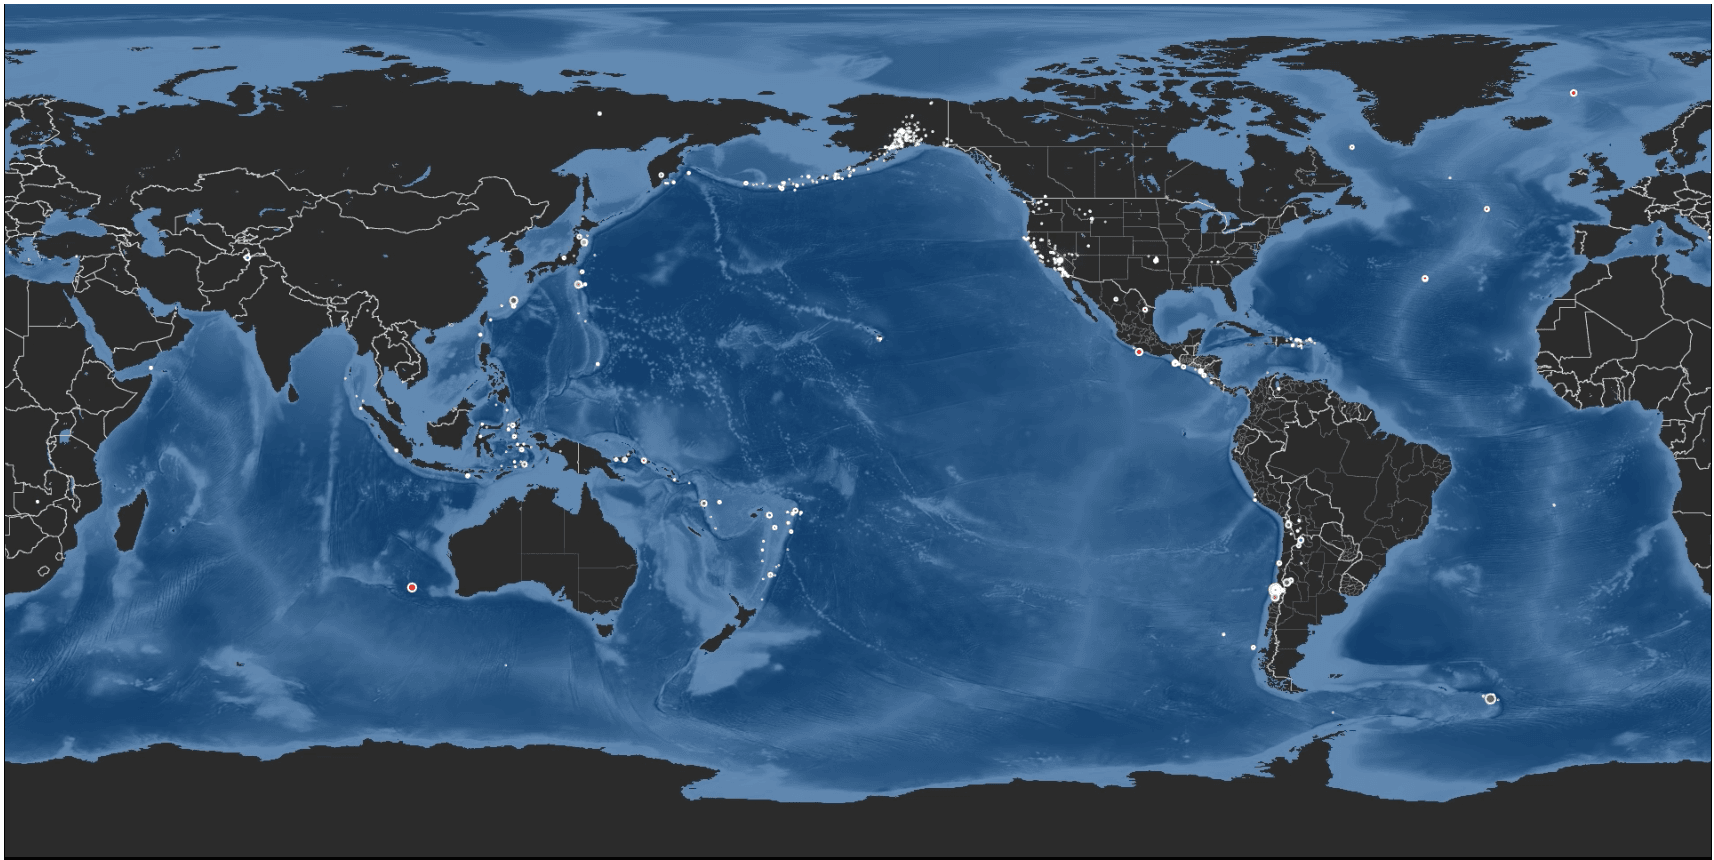
The second video, created by the GIS group of Kosova, shows the same data on a 3D globe.